New Space Application

Pipeline Monitoring Using
SAR Data

Introduction

 How can pipeline operators be sure that construction is taking place safely close to their infrastructure?

 Considering how large the territory must be covered, it’s a daunting task. Oil and gas pipelines cover thousands of miles, making it very difficult to monitor adjacent right-of-way corridors just by walking or driving.

During severe weather such as flooding, it may be impossible to traverse the ground on foot or by vehicle. Severe storms can also limit the ability to control the aircraft (for example, airplane, helicopter, drone) that would otherwise be used to monitor a pipeline.

responsibilities

Pipeline operators must be aware of any potential issues that could occur in the pipeline’s right-of-way, including urban encroachment, construction activity, illegal building activity, overgrown vegetation, flooding, and land deformation. If any of these events occur, the pipeline could be in danger.

It is important to have a high level of understanding of the area adjacent to the right-of-way, as notifications may need to be issued for various reasons, including in the event of an emergency.

Deep diving

In this article, we explore pipeline monitoring through an example of work that we can use.

The specific type of satellite technology used in this context is Synthetic Aperture Radar (SAR), which has an all-weather, 24/7 capability.

At SARsat Arabia, we have partnerships with many global providers of earth observation data that we process and turn into analytical results that are used to solve a range of problems, including pipeline monitoring challenges.

procedure

What are we doing ?

  1. Acquire SAR images at a regular rhythm over a long period of time.
  2. Apply SAR data analytics to identify any material changes to the infrastructure that may have occurred along the pipeline’s footprint.
  3. To visualize these changes, create a dashboard.
  4. Identify any clusters that need to be looked into.
  5. More detailed inspection with optical images.

Benefit

Why is it useful?

This method involves using a wide area SAR images for initial detection, along with optical images covering a smaller area for more accurate analysis. Image resolution and collection frequency can be customized to suit any requirement or budget.

After that, a crew for ground-level inspection may be dispatched, allowing operators to better allocate resources. The following example shows how we used SAR data analytics to monitor a pipeline.

practical example

These videos illustrate how these types of solutions work. In the first clip, scroll the footprint to see where the most changes happened along the route.

Possible New Construction (blue trapezoid) and Possible Deconstruction (red trapezoid) are two aspects in the Map Legend .

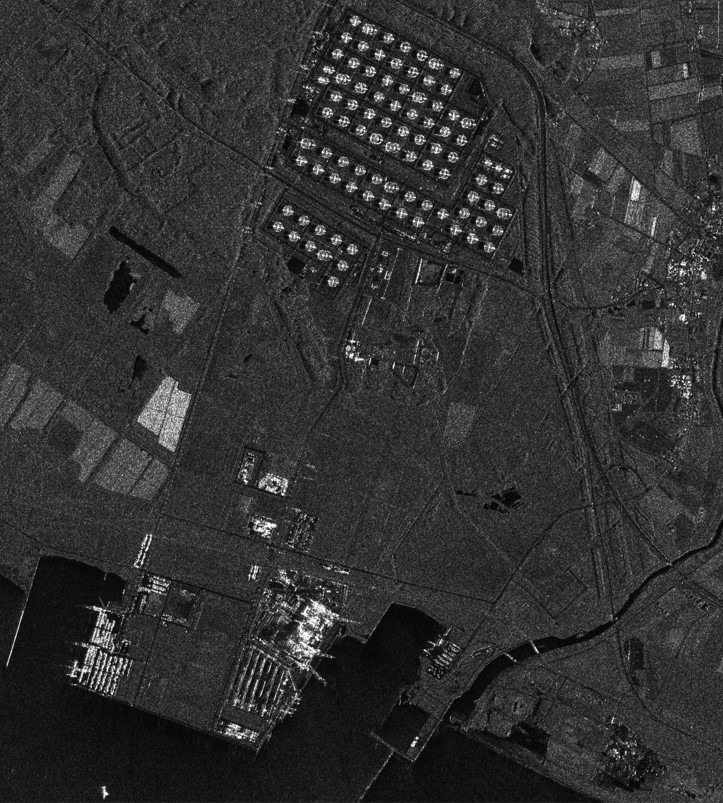
This enables us to visually detect major change clusters (Those are, places where new construction or deconstruction is likely to have taken place). We focused on two areas, dubbed Example 1 and Example 2, as a result of this.

Credit: Ursa Space
Credit: Ursa Space

The next video delves deeper into Example 1 and illustrates how it has changed over time.

There is certainly work going on, which could involve site clearing, material staging lots, and real building. Indeed, the optical imagery on the right indicates additional buildings that were not existing prior to the data acquisition date, confirming that our SAR-based analytics noticed a major change worth investigating further.

I'll show you how

Example 2 revealed a similar scenario: optical imaging indicated a cluster of activity on the site, suggesting the construction of a new building.

Credit: Ursa Space

I'll show you how

Ursa Space

Satellite Intelligence Company

SARsat Arabia

We have created a large network of satellites data providers, which we process and anlyze to turn it into solutions for our customers

Let us know if you are interested in learning more about our products and capabilities.